
 |
The strengths and weaknesses of US cities during a pandemic ON THIS PAGE: Large American cities most vulnerable to CoronaVirus ||| CoronaVirus ranking ||| Health vulnerability ||| Financial vulnerability ||| Economic vulnerability ||| Social vulnerability ||| Sources and Research author ||| |
|||||||||||||||||||||||||||||||||||||||||||||||||||||||||||||||||||||||||||||||||||||||||||||||||||||||||||||||||||||||||||||||||||||||||||||||||||||||||||||||||||||||||||||||||||||||||||||||||||||||||||||||||||||||||||||||||||||||||||||||||||||||||||||||||||||||||||||||||||||||||||||||||||||||||||||||||||||||||||||||||||||||||||||||||||||||||||||||||||||||||||||||||||||||||||||||||||||||||||
FRONT PAGE About us ON OTHER PAGES An American Dream for the 21st century Public health and racism in the US American mayors: Moral values in politics City Equity Offices to counter systematic racism in America List of US City Equity Offices African American Mayors Ending racism in American cities - a conversation with Rochester's (NY) first black mayor Police killings of Black Americans The strengths and weaknesses of US cities during a pandemic US local government structures US mayors (2020) US cities and Covid-19: Six pages of research & tables COVID-19 hits African Americans hardest |
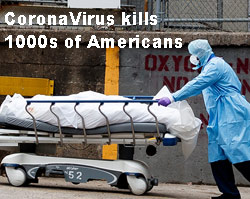 Large American cities most Large American cities mostvulnerable to CoronaVirus April 2020: New York City, San Francisco, Washington DC, Detroit and Miami have been named as the five American cities most vulnerable to a virus epidemic such as the current CoronaVirus (COVID-19) outbreak. New research examined the vulnerability of more than 100 cities based on their economic, financial, social and health strengths. According to the report, larger cities, due to their high population density, global connections and extensive use of public transport, are most exposed to the effects of a pandemic such as COVID-19. For example, 61 per cent of New Yorkers commute using public transport, while virtually every resident in Amarillo (TX), the third-least vulnerable city in the survey, uses private transport. Potentially, many of America’s most prosperous cities face significant disruptions during an epidemic, which affects large numbers of residents and hinders the normal flow of business. The research, which was conceived and carried out by Clever under the supervision of Francesca Ortegren, shows that eight of the top-ten most vulnerable communities are large cities. New York City, where 61 per cent of commuters travel by public transport, has only three acute hospital beds per 1,000 people. And with almost 11,000 residents per sqkm, the city also suffers from the highest urban population density in the US. The statistics for San Francisco, which is ranked second in the national vulnerability table, show how bad the New York's situation really is. In San Francisco only a third of commuters travel by public transport (NYC 61%), the population density is just under 7,000 people per sqkm (NYC 11,000) and the city has more than five acute hospital beds per 1,000 residents (NYC 3). Financially, Miami is the most vulnerable US city to a virus epidemic. There, a staggering 30 per cent of the residents have no health insurance, while a third of the city population live in poverty. According to the research, economically, Washington DC is the most vulnerable US city. The city’s debt stands at more than US$8,100 per resident and, a fact that counts against the city, more than three quarters of workers are employed by small companies. The research also devotes a chapter to social cohesion and placed particular importance to the willingness of residents to participate in activities for ‘the greater good’. According to the survey, in Elizabeth, New Jersey, only seven per cent of residents are civic minded, while in New York, which is placed seventh in this section, almost 40 per cent of citizens indicated a willingness to place the good of the community before any self-interest. CoronaVirus ranking: Vulnerability of large US cites (107 US cities were reviewed)
Health vulnerability: The ten most vulnerable US cities Health vulnerability factors include those that increase the rate of viral transmission, the availability of treatment and the percentage of high-risk citizens. Research principal Francesca Ortegren says: “We included the percentage of the population who commute via public transport and population density and proportion of the population living in overcrowded housing (i.e. more than 1.5 people per bedroom on average) in each city as measures of rapid spreading. The factors indicate that people are likely to be in close proximity to others and, therefore, are more likely to come into contact with or pass along COVID-19. The availability of treatment was defined as the number of acute care hospital beds available per 1,000 residents. The more beds available per person, the better chance people have at treatment and isolation once they're sick. We also included the percentage of the population who is 65 years old or older and living alone as an indication of accessibility of care. COVID-19 disproportionately impacts older adults, leaving people over 65 more vulnerable.”
Financial vulnerability: The ten most vulnerable US cities Financial vulnerability factors include the lack of health insurance, poverty, employment status and proportion of residents spending more than half of their income on rent. Research principal Francesca Ortegren says: “People's ability to afford care and participate in social distancing are directly tied to their financial stability and characteristics of their employment. Importantly, people who are not employed don't have health insurance, or spend over 50 per cent of their income on rent may not be able to afford hospitalisation or care if they become infected, increasing the likelihood that the virus will spread.”
Economic vulnerability The ten most vulnerable US cities Economic factors include city debt and workers relying on small-scale employers. Research principal Francesca Ortegren says: A city's economic vulnerability to widespread, potentially fatal disease has to do with possible long-term effects on the local economy as a direct result of a recession or measures taken to flatten the curve.”
Social vulnerability The ten most vulnerable US cities Social factors include civic engagement and the ability to innovate. Research principal Francesca Ortegren says: “We measured people's willingness to participate in activities for the “greater good” to indicate the likelihood that people in a certain city will cooperate with recommendations that reduce the spread of the virus. We also included innovation capabilities (as measured by the number of patents per capita) to estimate the ability for a community to quickly and efficiently help restore the economy.
Sources and author Sources: Robert Graham Centre - Social Deprivation Index (SDI); University of Notre Dame – Urban Adaption Assessment; Integrity Data; US Census Bureau – Annual community Survey and annual economic surveys. About Francesca Ortegren, research principal at Clever Real Estate: Francesca earned her PhD in Cognitive Psychology from Texas Tech University, conducted behavioural research on memory, learning, and teaching and taught college-level research methods and statistics courses. Follow @City_Mayors |