 Oslo is the most expensive city in the world  FRONT PAGE Site Search About us  UBS: Most expensive and richest cities ECA: Most expensive cities EIU: Most expensive cities Mercer: Most expensive cities World's top cities World's richest cities (GDP) Richest cities (earnings) Global Cities Index Most powerful cities World's best financial cities Europe's top city brands European growth cities 2009 Urban population growth from now to 2030 European business cities Best world cities to live in World's largest cities and their mayors 2010  Worldwide | Elections | North America | Latin America | Europe | Asia | Africa |                           |
The most expensive and
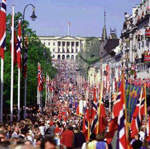
15 September 2012: Oslo, Zurich, Tokyo, Geneva and Copenhagen have emerged as the world's most expensive cities based on a standardised basket of 122 goods and services surveyed by UBS. The basket costs the least in Bucharest, Mumbai and Delhi. People in Zurich, Geneva and Copenhagen earn the most in the world, while the highest purchasing power is enjoyed in Zurich, Sydney and Luxembourg. |
| 2018 Earnings, Prices & Wealth Survey ||| Introduction ||| The most expensive cities ||| The richest cities ||| The most powerful cities ||| The Big Mac Guide ||| |
||
Prices
Oslo, Tokyo and Zurich are the most expensive cities in the world, according to the prices for a standardized basket of 122 goods and services. When rents are added to the mix, New York, Hong Kong and Dubai jump up in the list. By contrast, the cost of living is lowest in the Indian cities of Delhi and Mumbai. Ranking & table
Earnings
Oslo, Tokyo and Zurich are the most expensive cities in the world, according to the prices for a standardized basket of 122 goods and services. When rents are added to the mix, New York, Hong Kong and Dubai jump up in the list. By contrast, the cost of living is lowest in the Indian cities of Delhi and Mumbai. Ranking & table
Purchasing power
How much a wage is actually worth is best described by comparing purchasing power in relation to goods that are as homogenous as possible around the globe. Thus, in Tokyo it takes nine minutes of work to earn enough to buy a Big Mac, while in Nairobi it takes 81 minutes. Workers in Zurich can buy an iPhone after 22 hours work; in Manila, by contrast, it takes around 20 times longer.. Ranking & table
Comparative research
The 10 most expensive cities
according to Mercer, UBS, ECA and EIU
|
Rank
|
Mercer (2013)
|
UBS (2012)
|
ECA (2011)
|
EIU (2013)
|
|
1
|
Luanda | Oslo | Tokyo | Tokyo |
|
2
|
Moscow | Zurich | Oslo | Osaka |
|
3
|
Tokyo | Tokyo | Geneva | Sydney |
|
4
|
N’Djamena | Geneva | Nagoya | Oslo |
|
5
|
Singapore | Copenhagen | Zurich | Melbourne |
|
6
|
Hong Kong | New York City | Yokohama | Singapore |
|
7
|
Geneva | Luxembourg | Bern | Zurich |
|
8
|
Zurich | Stockholm | Stavanger | Paris |
|
9
|
Bern | Caracas | Basel | Caracas |
|
10
|
Sydney | London | Kobe | Geneva |
Working hours
People work the most in Asia, Africa, the Middle East and South America, at over 2,000 hours per year. The shortest working hours and highest number of days of paid vacation are enjoyed by workers in Western Europe. In South America, the picture is mixed: in Mexico City, workers receive the lowest number of paid days off out of all the cities surveyed, with an average of six days vacation a year, while their colleagues in São Paulo and Rio Janeiro enjoy considerably more, with an annual vacation entitlement of 30 days on average.
WORLD REGIONS
North America
Prices for our standardized basket of goods and services are lowest and wages compared with the global average are highest in North America. In terms of purchasing power, all US cities rank higher than Toronto and Montreal; this can be explained above all by the fact that net hourly wages are 20 percent lower on average in these Canadian cities.
Even though prices in the US are higher than the global average, prices for electronic and household goods are very attractive in North American cities, with Miami and Los Angeles boasting the best deals in international comparison.
Asia and Pacific
Nowhere is the discrepancy between prices and wages within an individual region larger than in Asia. For example, food costs five times as much in Tokyo than it does in Mumbai, while wages in Tokyo are twelve times higher than in Delhi.
There is no Asian city at the top of the domestic purchasing power rankings when measured in terms of net hourly wages. The Australian city of Sydney has the second-highest domestic purchasing power in international comparison.
Price levels in Sydney and Auckland have risen sharply versus 2009, due not least to the appreciation of these countries' currencies against the euro and the US dollar. To offset this, however, wage levels in both cities have also increased.
Europe
Not only prices for goods and services but also wages are lower in Eastern Europe than in Western Europe. Prices in Eastern Europe are 36 percent lower on average than in Western Europe. This discrepancy in prices is more than offset by the fact that workers in Western Europe are paid at least three and a half times more than their Eastern European neighbors, however.
A comparison with 2009 shows that the euro has depreciated relatively strongly against other Western and Eastern European currencies, with the exception of the Romanian leu. This depreciation of the euro is also evident when comparing prices in Western Europe: apart from Luxembourg, all Western European cities that use the euro as a currency of payment have a lower price level than cities outside the European monetary union.
The iPod index
One vivid way to illustrate the relative purchasing power of wages is to replace the abstract basket of goods and services with a specific, highly uniform product that is available everywhere with the same quality, and then calculate how long an employee would have to work to be able to afford it in each city. The study determined that employees have to work a global average of 37 minutes to earn enough to pay for a Big Mac, 22 minutes for a kilo of rice and 25 minutes for a kilo of bread. For the first time, a non-food product was used in the study to compare working hours.
The iPod nano with 8 GB of storage is an ideal example of a globally uniform product. An average wage-earner in Zurich and New York can buy a nano from an Apple store after nine hours of work. At the other end of the spectrum, workers in Mumbai, need to work 20 nine-hour days – roughly the equivalent of one month's salary – to purchase an iPod nano. Ranking & table
Follow @City_Mayors
Related research
| THE MOST EXPENSIVE AND RICHEST CITIES IN THE WORLD UBS survey (2012): Most expensiv and richeste cities (Intro) | World's most expensive cities (table) | Richest cities by personal earnings (table) | Richest cities by purchasing power (table | The iPod index | ECA International survey (2011): Introduction | Table: World | Table: Europe | Table: Asia | Mercer survey (2013): Most expensive cities EIU survey (2012): Most expensive cities RICHEST CITIES BY GDP Introduction | 150 richest cities in 2005 | 150 richest cities in 2020 | Europe's richest cities | |