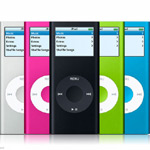
 The average employee has to work nine hours to afford an iPod nano, whereas in Mumbai he has to work 177 hours  FRONT PAGE Site Search About us   UBS: Most expensive and richest cities ECA: Most expensive cities EIU: Most expensive cities Mercer: Most expensive cities Global Cities Index World's top cities World's richest cities (GDP) Richest cities (earnings) Most powerful cities World's best financial cities World's top start-up locations Europe's top city brands European growth cities 2009 Real estate USA Real estate Europe European business cities Best world cities to live in World's largest cities and their mayors 2010  Worldwide | Elections | North America | Latin America | Europe | Asia | Africa |                            |
The iPod index
Ranking: The richest cities in the world |
| 2018 Earnings, Prices & Wealth Survey ||| Introduction ||| The most expensive cities ||| The richest cities ||| The most powerful cities ||| The Big Mac Guide ||| |
||
|
Rank 2009
|
Cities
|
Hours of work needed to buy an iPod nano
|
|
1
|
New York |
9.0
|
|
2
|
Zurich |
9.0
|
|
3
|
Los Angeles |
9.5
|
|
4
|
Sydney |
9.5
|
|
5
|
Dublin |
10.0
|
|
6
|
Geneva |
10.0
|
|
7
|
Luxembourg |
10.0
|
|
8
|
Miami |
10.0
|
|
9
|
Montreal |
10.5
|
|
10
|
Oslo |
10.5
|
|
11
|
Toronto |
10.5
|
|
12
|
Copenhagen |
11.0
|
|
13
|
London |
11.0
|
|
14
|
Stockholm |
11.0
|
|
15
|
Chicago |
11.5
|
|
16
|
Tokyo |
12.0
|
|
17
|
Helsinki |
12.5
|
|
18
|
Brussels |
13.0
|
|
19
|
Amsterdam |
13.5
|
|
20
|
Frankfurt |
13.5
|
|
21
|
Munich |
13.5
|
|
22
|
Berlin |
14.0
|
|
23
|
Vienna |
14.0
|
|
24
|
Lyon |
15.0
|
|
25
|
Nicosia |
15.0
|
|
26
|
Paris |
15.0
|
|
27
|
Madrid |
15.5
|
|
28
|
Auckland |
16.0
|
|
29
|
Barcelona |
16.0
|
|
30
|
Milan |
16.0
|
|
31
|
Hong Kong |
19.0
|
|
32
|
Lisbon |
19.5
|
|
33
|
Rome |
19.5
|
|
34
|
Dubai |
20.0
|
|
35
|
Seoul |
22.0
|
|
36
|
Tel Aviv |
22.0
|
|
37
|
Manama |
23.0
|
|
38
|
Taipei |
23.5
|
|
39
|
Athens |
24.5
|
|
40
|
Singapore |
27.5
|
|
41
|
Ljubljana |
32.0
|
|
42
|
Doha |
35.0
|
|
43
|
Moscow |
36.0
|
|
44
|
Tallinn |
39.5
|
|
45
|
Johannesburg |
41.5
|
|
46
|
Prague |
43.0
|
|
47
|
Bratislava |
45.5
|
|
48
|
Warsaw |
45.5
|
|
49
|
São Paulo |
46.5
|
|
50
|
Riga |
51.0
|
|
51
|
Kuala Lumpur |
52.0
|
|
52
|
Istanbul |
56.0
|
|
53
|
Rio de Janeiro |
56.0
|
|
54
|
Shanghai |
56.5
|
|
55
|
Bogotá |
62.5
|
|
56
|
Bucharest |
63.5
|
|
57
|
Bangkok |
66.0
|
|
58
|
Budapest |
68.5
|
|
59
|
Santiago |
69.5
|
|
60
|
Beijing |
73.0
|
|
61
|
Vilnius |
74.5
|
|
62
|
Sofia |
78.0
|
|
63
|
Kiev |
82.0
|
|
64
|
Lima |
86.5
|
|
65
|
Jakarta |
93.0
|
|
66
|
Mexico City |
95.0
|
|
67
|
Caracas |
97.0
|
|
68
|
Buenos Aires |
99.0
|
|
69
|
Cairo |
105.0
|
|
70
|
Delhi |
122.5
|
|
71
|
Manila |
128.5
|
|
72
|
Nairobi |
160.0
|
|
73
|
Mumbai |
177.0
|
UBS survey: Introduction | The most expensive cities | The richest cities (personal earnings) | Richest cities (purchasing power) | The iPod index |
Methodology
USB conducted its standardized Prices and Earnings survey in 73 international cities in March 2009. The data was collected by several independent observers in each city. In all, more than 30,000 data points were included in the analysis. All amounts were converted into a single currency to ensure that the surveyed prices and earnings could be compared. To compensate for daily exchange rate fluctuations, we used the average exchange rate over the data collection period. An international price comparison needs a common, standard basket of goods and services. As in past studies, the basket of goods and services was based on Western European consumer preferences. Living costs were calculated based on a survey of 154 items in total. They include 122 products and services that are used directly to calculate the reference basket. Apartment rents were classified as high-, mid- and low-priced.
Follow @City_Mayors
Related research
| THE MOST EXPENSIVE AND RICHEST CITIES IN THE WORLD UBS survey (2012): Most expensiv and richeste cities (Intro) | World's most expensive cities (table) | Richest cities by personal earnings (table) | Richest cities by purchasing power (table | The iPod index | ECA International survey (2011): Introduction | Table: World | Table: Europe | Table: Asia | Mercer survey (2012): Most expensive cities EIU survey (2013): Most expensive cities RICHEST CITIES BY GDP Introduction | 150 richest cities in 2005 | 150 richest cities in 2020 | Europe's richest cities | |
THE LARGEST CITIES IN THE WORLD AND THEIR MAYORS 2011
Introduction
Cities by size: 1 to 150 | 151 to 300 | 301 to 450 | 451 to 550 |
Cities in alphabetical order: A to D | E to L | M to R | S to Z |
Cities by countries: A to D | E to L | M to R | S to Z |